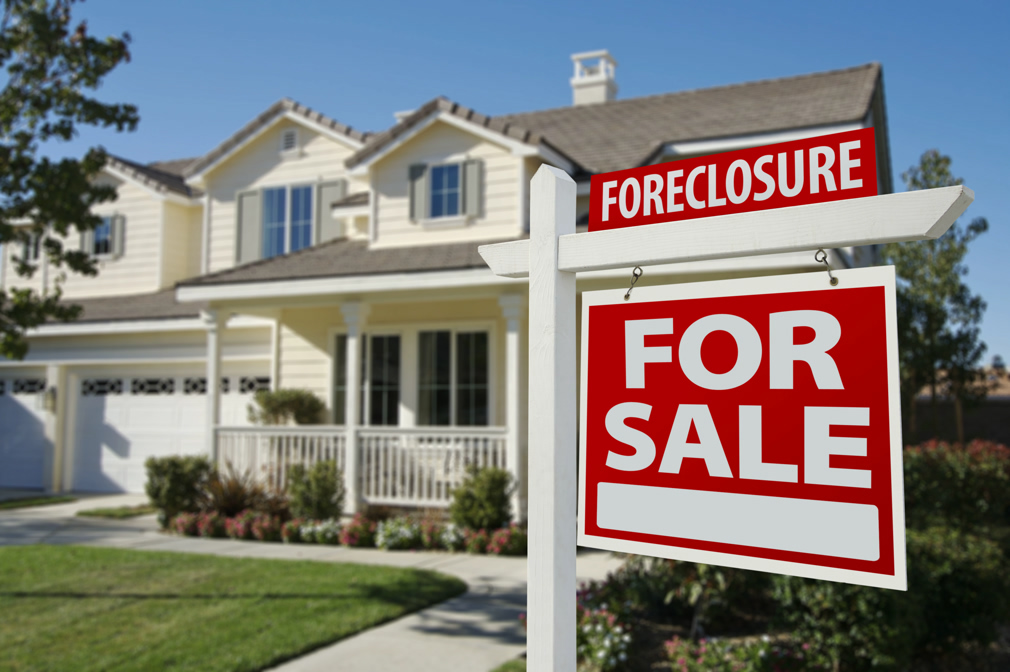
Foreclosure Trends in Recent Years
The foreclosure landscape has remained relatively stable for an extended period, even leading up to the COVID-19 pandemic. Since then, the data suggests that foreclosure rates have been unusually low. Despite various foreclosure prevention efforts, we have yet to see a return to pre-pandemic foreclosure levels.
Risk associated with late-cycle lending is an ongoing concern in any economic cycle affecting the housing market. Looking back, the deterioration of housing credit began years before the onset of the 2008 Great Recession. Comparatively, the current housing credit environment is in a healthier state than the conditions observed with credit cards, auto loans, and student debt.
Insights on FICO Scores
Since the implementation of Qualified Mortgage (QM) standards in 2010, FICO scores related to housing have shown strong performance. A significant number of borrowers are opting for 30-year fixed-rate mortgages, which help maintain stable debt obligations. Over the past fourteen years, increases in wages have contributed to a stable cash flow for many homeowners.
Examining the reasons behind the U.S. economy’s resilience since 2010, excluding the pandemic’s impact, highlights the crucial roles played by the QM mortgage law and the 2005 bankruptcy reform. These measures have moderated household credit expansion, thus averting large-scale consumer over-leverage and contributing to economic stability.
Conclusion: The Current State of Homeowners and Housing Credit
While signs of credit stress are appearing in areas such as credit card debt, auto loans, and student loans, homeowners generally appear to be in a stable financial position on paper. However, it’s important to note that in the event of a future recession, renter households may experience the most significant impacts. Conversely, many homeowners not only maintain strong credit scores but also have substantial equity in their properties.
We closely monitor housing credit data and new listings to stay informed on potential shifts in the market. During the previous housing crisis, delinquency rates soared near 15 million, leading to substantial foreclosures and losses in home equity as property values declined. Presently, many homeowners have built considerable equity, with nearly 40% of properties in the U.S. being mortgage-free.
Currently, new property listings are approaching pre-pandemic norms, with seasonal peaks ranging from 80,000 to 110,000 listings weekly. This is a stark contrast to the housing bubble era, where new listings consistently reached between 250,000 and 400,000 per week over several years. With recent improvements in credit markets, no immediate signs of stress are evident in the data.

