

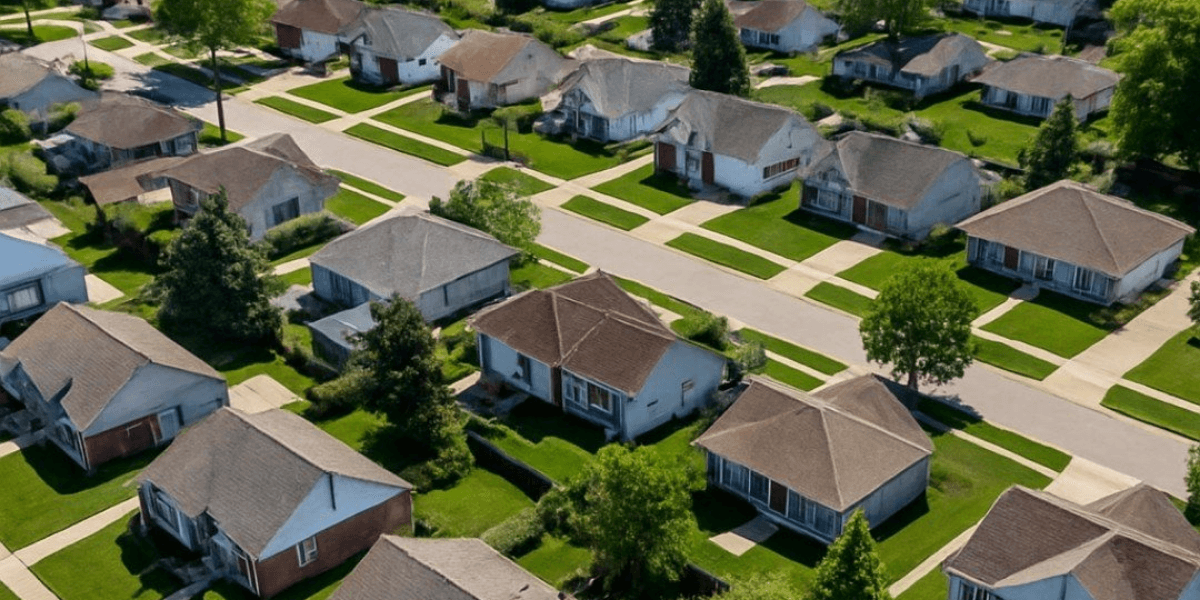
The national residential vacancy rate remained at 1.3% during the third quarter, according to property-data findings released Friday, providing another indication that unused housing inventory remains limited across much of the United States.
ATTOM's latest analysis found that approximately one in every 76 residential properties nationwide was vacant. The overall rate was unchanged from the previous quarter, although conditions varied substantially across states, metropolitan areas and individual neighborhoods.
The report offers an important measure of housing-market conditions because vacancies can provide insight into available supply, neighborhood stability and the number of properties that may eventually return to the market.
A low vacancy rate does not necessarily mean homes are affordable or that demand is equally strong everywhere. It does, however, indicate that relatively few residential properties are sitting unused nationwide.
The data arrive during a period in which housing availability remains a central issue for buyers, sellers and real-estate professionals. Mortgage rates remain in the mid-6% range, while affordability pressures continue to influence where consumers search for homes.
ATTOM also examined so-called zombie properties, homes that are vacant while moving through the foreclosure process. The share of pre-foreclosure properties considered vacant declined slightly to approximately 3.3%, according to the report.
Zombie properties became a closely watched indicator following earlier housing downturns because concentrations of abandoned homes can affect surrounding property values and neighborhood conditions.
The current figures suggest that they remain a relatively small part of the broader residential market.
Vacancy levels vary considerably by geography. Markets with declining populations or weaker local economies can experience higher rates of unused housing, while fast-growing regions may have extremely limited vacancies despite active construction.
That variation matters for real-estate professionals because national averages can conceal dramatically different local conditions.
A metro with a 1% vacancy rate may face supply constraints and intense competition for available properties. Another area with more vacancies may provide buyers with greater negotiating leverage but could also reflect weaker housing demand.
The latest data come as other housing research shows buyers increasingly looking beyond their current metropolitan areas.
Realtor.com reported that 60.1% of online home views originating from the nation's 100 largest metros during the second quarter went to listings outside the shopper's home market. That was up from 59.1% a year earlier and 48.2% during the comparable pre-pandemic period.
Together, the trends show how housing supply and affordability are reshaping buyer behavior.
When available inventory is limited or prices exceed local budgets, prospective buyers may widen their searches to neighboring cities, different states or regions where housing costs are lower.
Vacancy rates also affect investors and property managers. A property that remains occupied generally generates income, while prolonged vacancies can increase maintenance expenses and reduce operating returns.
At the same time, extremely low vacancy levels can signal insufficient housing availability for households trying to relocate or enter the market.
The national figure therefore presents a mixed picture. Limited vacancy suggests that most residential properties remain in use, but it also reinforces concerns about whether enough housing exists in communities experiencing population growth and sustained demand.
Builders have been adding homes in many regions, particularly across parts of the South, yet construction alone has not eliminated broader affordability challenges.
Higher financing costs, land prices, construction expenses and local development restrictions can affect how quickly new housing enters the market.
For agents and brokers, the latest figures reinforce the importance of evaluating conditions at a local level rather than relying exclusively on national housing statistics.
The 1.3% vacancy rate provides a broad benchmark, but neighborhood inventory, price trends, employment growth and migration patterns remain essential to understanding individual markets.
Friday's report ultimately points to a residential landscape where unused housing remains limited nationally even as buyers become increasingly flexible about where they are willing to live.
That combination is likely to keep housing supply, affordability and migration among the central forces shaping the U.S. property market.

Top Listings Contributor
Covers market analysis and property technology, tracking where the data and the tools are pushing the industry next.
This article features partner, contributor, or branded content from a third party. Members of the Top Listings editorial staff were not involved in the creation of this content. All views and opinions are those of the contributor alone.


Related Posts